LightViz: Autonomous Light-field Surveying and Mapping for Distributed Light Pollution Monitoring

Sheng-En Huang, Kazi Farha Farzana Suhi, and Md Jahidul Islam

Pre-print Code (coming soon)

The Problem: Artificial Light Pollution


Over 80% of the world and almost all U.S. cities and urban skylines are affected by artificial light pollution. With the rapid growth of metropolitan areas and coastal cities, alarming levels of light pollution result in significant long-term consequences for both humans and other animals. Contemporary research over the past decade has shown that light pollution negatively impacts human health by disrupting natural sleep cycles, causing chronic sleep deprivation, which in turn increases risks for high blood pressure, exhaustion, and depression. Moreover, various animals such as sea turtles, bees, squirrels, birds, and insects experience the disruption of their nocturnal patterns by long periods of light exposure, direct glare, and sky glow. Studies have evidenced that these severely affect their natural reproductive cycles, cause hormonal dysfunctions, and trigger serious long-term health issues.


For instance, light pollution in beachfront areas has caused significant habitat loss for sea turtles across the globe. In fact, the Endangered Species Act has listed all six sea turtles as endangered in the U.S. coastal waters. To mitigate the adverse consequences of light pollution on human health and wildlife habitats, long-term community initiatives and sustainable policy decisions are essential. The development of next-generation tools for measuring and LPM (light pollution monitoring) more effectively.

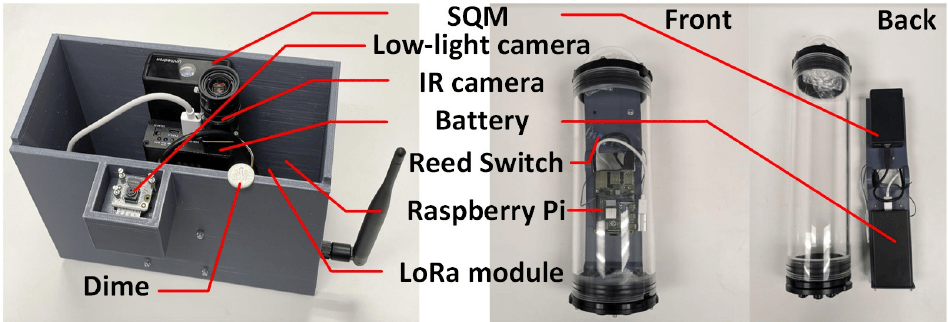
To measure artificial light pollution, standard ambient light sensors (TSL2591, SQM) capture single-point radiance measurements, while the satellite imagery (NASA VIIRS, World Atlas) generate continental-scale maps that only identify pollution-prone areas; see these online maps. However, these methods fail to identify pollutant sources and quantify their individual and collective "light footprint". Contemporary works use robotics and automated tools for high-resolution light surveying with promising results. However, these efforts are not scalable as an LPM tool for effective policy implementation at a county, city, or state level.

By exploring the existing LPM technologies, we hypothesize that a lightweight and interactive light-field sensing and mapping system can significantly enhance the accuracy, resolution, and scalability of LPM compared to traditional methods. By automating data collection, integrating advanced simulation and attenuation models, and providing real-time high-resolution visualizations, we will be able to identify pollution sources effectively, assess their impacts on vulnerable communities, and facilitate the development of informed and sustainable light pollution mitigation policies.

Low-resolution light pollution maps from existing interfaces: VIIRS and World Atlas data are shown for St. Augustine, FL, US in the top row (a-b). In the bottom row (c-d), high-resolution maps generated by LightViz are shown, which embed fine-grained information for effective LPM.


LightViz: Contributions


LightViz is an interactive interface designed to survey, simulate, and visualize light-fields and light pollution maps in real-time, as shown in the Figure above. The core strength of LightViz lies in its integration of light source placement and a light attenuation model, enabling the generation of light-field maps with fine-grained detail and local continuity. Existing light-field measurements based on satellite imagery or ground-based single-point sensor nodes suffer from low sampling rates, varying resolution, and high latency. The considerable cost and time required for high-resolution measurements further constrain comprehensive LPM at scale. LightViz overcomes these limitations by: (1) offering end-to-end light-field rendering; (2) simulating light sources to produce dense maps at significantly higher resolutions; (3) capturing fine-grained variations in local light-field data; and (4) addressing latency issues in global map generation. In addition, it facilitates exploring effective light pollution mitigation strategies. users can load existing data and simulate new data to investigate key questions such as: (Q1) How do the intensity and spatial distributions of light pollution vary across urban, suburban, and rural environments?; (Q2) What are the primary factors contributing to light pollution in a given vulnerable area? (Q3) How can systematic and effective mitigation strategies be developed to address these issues? Lastly, we introduce a quantitative model to assess the light footprint of individual and collective light sources on a given area.

Existing sensors and data modalities for LPM: (a) Pros and cons of various sensing modalities; (b) Different twilight types; and (c) luminance meter and SQM for single-point radiance sensing.

The design and implementation of our remote light-field sensor node: it consists of an SQM, low-light cameras, LoRa communication interface, and a portable power source. It can be used in standalone operation for overnight data collection as well in GPS-guided mobile operation on coastal waters with an ASV (autonomous surface).

Remote Light-field Sensing and Estimation


We conduct comprehensive field assessments of the remote LPM system in both beachfront communities and closed-water (lake) environments. The standalone module is first deployed at Jensen Beach, FL for long-term operation. As shown in the Figure right, six observation locations are selected uniformly surrounding a beachfront waterbody. The exact GPS coordinates are marked and the nodes continuously capture timestamped light intensity data for 30-minute intervals; a sample result is shown in (b). On the other hand, on-water data is collected on a BlueBoat ASV; GPS-guided missions are planned with multiple respective waypoints, which the ASV followed at a constant rate. The correspinding light-field maps (World Atlas data) and contour maps are shown in (c) and (d), respectively.

We compare these maps generated from the space-borne World Atlas data quantitatively with our on-ground dense light-field measurements. We investigate six SOTA interpolation methods: standard Inverse Distance Weighting (IDW) Interpolation, Shepard Interpolation, Kriging Interpolation, Radial Basis Function (RBF) Interpolation, Inverse Distance Weighting (IDW) with Variable Power, and Nearest-Neighbor Interpolation (NNI). The goal here is to obtain continuous light-field values on these regions for comparative analyses with the World Atlas data.

For the evaluation, we first measure the interpolation performance of SOTA methods from our field experimental data. Specifically, we select 5 known data points along the waterbody boundary and estimate the 6th point. The estimated values and averaged errors are evaluated for single-point measurements. Next, we randomly select five sample points and iteratively calculate the interpolated light-field values from our known ground measurements. We find that the interpolated values from all SOTA algorithms differ significantly from those of the World Atlas data (which is based on low-resolution satellite imagery. This validates our argument that geo-spatial interpolation at such low resolution does not produce accurate light-field maps in local communities. Please refer to the paper (Table 1) for detailed wuantitative analyses.

Illustrations of our field deployment for distributed LPM in: (a) Jensen Beach, FL; (b) Aggregated data is shown for six specific locations; (c) Light-field map from World Atlas data; (d) Light-field contour map via spatial interpolation.


LightViz: Interactive Light-field Estimation


LightViz is an interactive software interface to visualize, simulate, and map light-field for distributed LPM. The GUI (graphical user interface) of LightViz in operation is shown below; it encompasses novel features to incorporate light attenuation models, configure various light sources, select SOTA interpolation methods and map rendering techniques, and generate on-demand local and global maps for LPM.

Estimating accurate light attenuation curves is challenging due to the dependencies on complex physical properties of light-particle interaction in a given environment. We follow the general practice in the literature to simplify this process using curve fitting. As discussed in detail in the paper: we adopt a quadratic attenuation pattern with two parameters estimated by measuring light intensities at various distances from the source using an SQM. Note that the integration of any other physically accurate model to LightViz is trivial; users can enter exact values (if known) or simulate various configurations of light source types, eg, narrow emission spectra (LED lights), broader spectra (high-pressure sodium lights), broader spectra with rapid attenuation (incandescent bulbs), etc. Besides, the number and arrangement of measurement points are also critical for accurate interpolation. The resolution of the interpolation depends on the number of points, which users can adjust based on their requirements. To ensure meaningful results, at least three non-collinear points are minimally required, although 20 or more points are ideal to generate meaningful results. LightViz includes a built-in validation to check for sufficient and properly arranged points, providing user feedback when necessary. This approach balances practical usability with flexibility, enabling users to model light attenuation effectively under different scenarios.
As a case study, we use the streetlight data of St. Johns County from ArcGIS Hub as our initial light-source layout in LightViz. This dataset covers the downtown area as well as some sparse lighting data over the entire county as a blueprint. In LightViz, we expand this with 6,000 additional light sources by following this blueprint for entry/exit ramps, intersections, densely populated areas, and curves with pedestrian traffic. The Figure above shows a snapshot of our light-source layout; LightViz allows us to configure light sources and their profiles at the street level, extend existing layouts, and simulate various future layouts, eg, for new residential areas. In addition to high-resolution light-field generation and vulnerable area detection, LightViz allows effective community policy identification for conservation. To mitigate and contain light pollution in vulnerable communities or new residential areas, it is important to know which light sources to use and where, their optimal usage patterns, and measure/track the amount of light footprint of those sources. To this end, we demonstrate how LightViz can be used to (i) formulate a light source placement strategy; (ii) identify optimal light source types; and (iii) measure and track light footprints of pollutant light sources in a given area.

Please checkout Our Paper for the detailed experimental analyses and use cases. Code release is coming soon!

Acknowledgments


This work is supported by the UF research grant #132763. The authors would like to acknowledge the help from Dr. Blair Witherington of Inwater Research Group Inc. and Rachel Tighe at the Archie Carr Center for Sea Turtle Research. We also thank Dr. Cathi Campbell and Dr. Cynthia Lagueux at UF Department of Biology for their help and support in showcasing our early ideas and prototypes at the 2022-23 Light Pollution Management Workshop events.